Filtering your search.
When accessing the Web - Analysis page you will be presented with 5 following filtering options:
- Time Filter
- Set your time filtering according to your needs. You can choose between many different presets or set your own specific time range

- For more information about the time filtering options, we advice you to look at Splunk's own documentation of the time range picker.
-
Application
- Choose between your applications from the dropdown list or choose to see all applications results.
-
Transaction
- Choose between the available transactions in the dropdown list or choose to see all transaction results.
*Options available in the Application and Transaction dropdown menu's depend on your specific setup.
Resolution of results.
Aggregation of data will always be considered when looking at big amounts of data because there are constraints, such as the physical size of the graph or chart showing the data.
The amount of data points extracted will quickly exceed the available space to show data, hence we need to make rollup's of the data.
When you choose a time filtration it affects which resolution the results are shown in.
There are 3 built in resolutions available:
-
No rollup
When viewing data within the last 6 hours from present time. -
Hourly
When viewing data later the last 36 hours / 1½ days.
Time frame

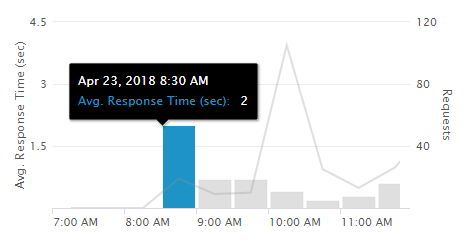
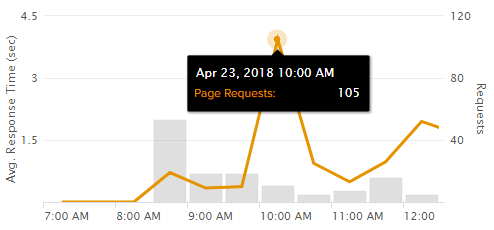
Shows a timeline displaying counts of requests at given date/times.
When hovering above a single bar in the graph, a popup window will show details for the average single response time reading.

The orange lines shows a count of page requests.
Hover the mouse over one of the yellow line to see more detailed information about the request count and date/time.

Page Requests.

Shows a table of the different user interfaces and the following columns:
-
Timestamp: A time stamp in the format <YYYY-MM-DDThh:mm:ss>.
-
Average response time: How long time in average the measured response time was, in seconds.
-
Transaction: Name of the transaction.
-
Identifier: Name of the identifier that the transaction reacts on.
-
Location: Name of the country from where the request is made.
-
Browser: Shows what browser was being used for the request.
- SLA: A value based on the SLA definition from one of the following 3 options:
1. Satisfied
2. Tolerated
3. Frustrated
Service Level Agreements, are defined in the SLA chapter.
For more information about SLA, look here. - Session ID: Unique ID for the specific session.
-
Username: Name of the user who performed the request.
Showing a page request breakdown.
If you wish to see additional information about a page request you can break it down by clicking a row in the "Page Request" table.
Then a new window shows up in the right side, by the name "Page request breakdown", with 3 tabs available:

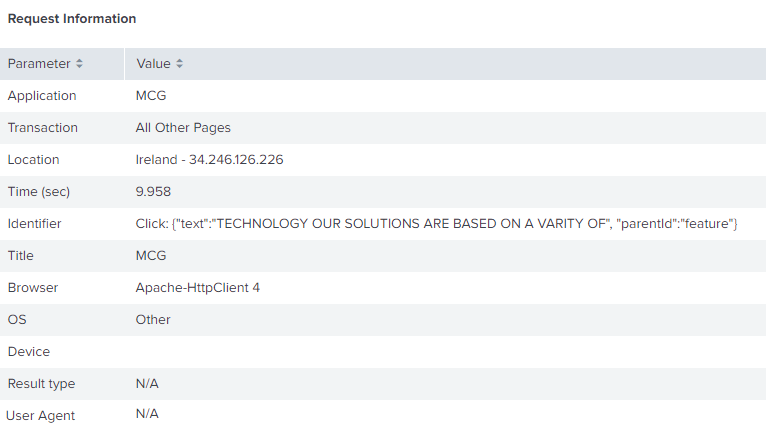
Show Request Information tab

