SLA
Accessing the SLA page.
The SLA page can be accessed by clicking the "SLA" link in the top menu bar:

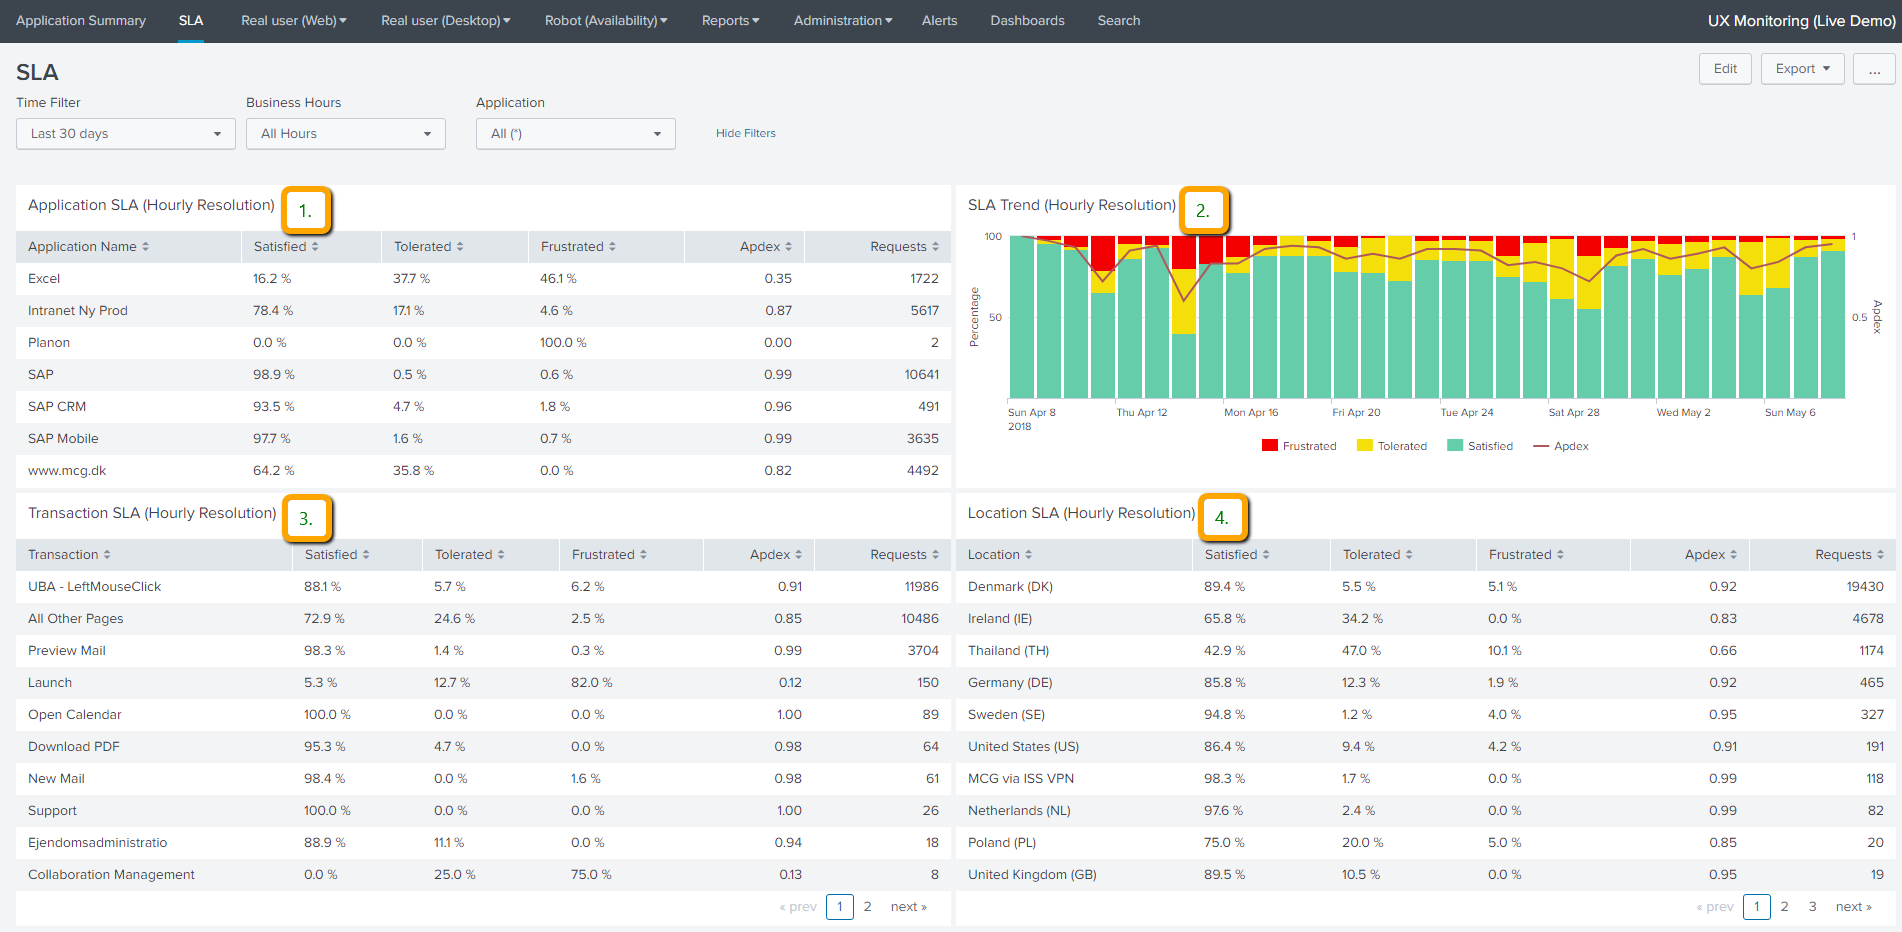
Once at the SLA page, you will be presented with some filter options and 4 information panes:
SLA Page overview

Filtering results.
You can filter the results you wish to see, from the 3 dropdown menu's in the top of the page.
The filtering will affect all results shown in the 4 panes.

Content description
For the 3 tables Application SLA (1), Transaction SLA (3) and Location SLA (4) the following is shown:
- Application/Transaction/Location name: Name of the application/transaction or location.
- Satisfied: Percentage of requests that are within the satisfied SLA definition. (Under X seconds)
- Tolerated: Percentage of requests that are within the tolerated SLA definition. (Over X and under Y seconds)
- Frustrated: Percentage of requests that are within the frustrated SLA definition. (Over Y seconds)
- Apdex: The apdex score is based on the ratio of satisfied and tolerating requests to the total requests made.

- Requests: A count of requests made within the given timeframe.
For the SLA Trend bar chart (3):
- Y-axis: Shows percentage (0 - 100%) of Satisfied, Tolerated and Frustrated counts.
- Y-axis 2: Shows Apdex score ranging from 0.0 to 1.0 (Best all measurements inside SLA requirements)
- X-axis: Shows date/time.
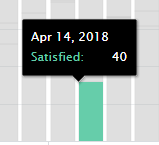
When hovering over a single bar, further details about the percentage can be seen:
SLA definitions
To see how the SLA's are defined, go to: Administration - SLAs
At the SLA's page you can
- Define Satisfied and Frustrated SLA times.
- Bulk edit / mass update changes for different SLA's
